
Insights from Kevin Shea

By Kevin W. Shea, CFA
Editor’s note: This article has been updated as of April 2025 and originally appeared in our January 2025 issue.
Uncorrelated spoke with Kevin Shea at Disciplined Alpha about the Harbor Long-Short Equity ETF and his updated views on the overall U.S. equity market. The discussion is summarized below.
Uncorrelated: Can you provide a summary of the ETF and the compelling features it offers?
Kevin Shea: The ETF invests in Large Cap and Mid Cap U.S. stocks. It has four distinct features that include a Regime Model that determines gross and net exposure and Growth versus Value style tilts, distinct Industry Group based stock selection models, a separate Short Model, and an Alpha Opportunity Model that determines which parts of the market have the most opportunity to generate alpha.
Uncorrelated: Can you describe how you developed these four features? Perhaps connect them to your broader career and the roles you had over time. For structure, please organize them chronologically. Which feature did you develop first?
KS: While we are probably best known for our Regime Model, the first feature I developed was the distinct Industry Group based stock selection models. My first career was in Biotech. In the early 1990s, I worked at a biotech company in Boston doing HIV research. It was intense work, as there were no drugs on the market for HIV. If somebody got infected, their life expectancy was only 24 months. I worked with a team to develop an antibody. This research turned into a Master’s Thesis, an article, a patent, and ultimately a drug in clinical trials.
Due to the progress on the scientific front, we needed a business development person. I started working in this role part time while pursuing and earning an MBA, with a concentration in Finance and a minor in International Studies.
After graduating in 1995, I entered the Management Development Program at John Hancock that involved rotations in several parts of the firm. The first rotation was in the Health Insurance division. This made me reflect on the fact that Biotech and Health Insurance are both Industry Groups within the same Health Care Sector, but they are fundamentally different from each other. Biotech companies make significant investments in research and development (R&D), to develop distinct products protected by patents, over a decade plus product development cycle, and with heavy national regulatory hurdles to overcome prior to marketing. Health Insurance companies typically make relatively little investments in R&D over a much shorter product development time are more focused on operational product efficiency, and also look for the general account to seek to increase in value over time in order to pay out future claims.
Due to the inherent fundamental differences in the business models of the companies in these Industry Groups, it seemed natural from a stock selection perspective to build Industry Group dependent models.
I subsequently rotated to three different groups in the mutual fund division of John Hancock. I attended meetings with company managements and sellside fundamental analysts across all Industry Groups. The insights gained from these and subsequent meetings, which now number over 1,000, has allowed me to gain insight into the drivers of stock performance within a given Industry Group. I have taken these insights and rigorously backtested them to build Industry Group dependent stock selection models.
This is a very differentiated feature of the strategy. The investment management industry has evolved over the years, but we believe it is still tilted toward fundamental analysis for stock selection. While fundamental managers and analysts know a lot about the companies they cover, they generally have not backtested their conclusions about the specific drivers of performance. Quantitative managers and analysts, on the other hand, frequently run backtests, yet in our experience very few ever talk to company managements to understand the business models of the companies they are trying to model. Very few managers and analysts try to both understand the compelling fundamental drivers of performance within a given Industry Group, as well as backtest those ideas before incorporating them into an investment strategy. We think it is important to do both.
Uncorrelated: Interesting. Which were the next of the four features that you developed?
KS: I developed the separate Short Model followed by the Alpha Opportunity Model. I joined Invesco to build a Mid Cap product in 1999. Shortly after I arrived, the market started to decline significantly. While the overall U.S. equity and the Nasdaq declined, I noticed that the stocks that declined the most were not necessarily the worst ranked stocks in our existing Long Model. This led us to explore the idea of building a separate Short Model. We weren’t directly shorting stocks at the time, so we called this a Bomb Avoidance model. It was exciting to find predictors of underperformance, which we combined into an overall Model. It was somewhat frustrating; however, to not just avoid the stocks likely to underperform, but to potentially be able to actively take advantage of this insight by selling them short.
A couple of years later I had the opportunity to build a Market Neutral product at a predecessor firm to Disciplined Alpha, D.A. Capital Management. As there are fewer tools to work with in Market Neutral than a variable exposure product, it is important to focus on those parts of the market where you are rewarded for being correct. This work led to our Alpha Opportunity Model.
Uncorrelated: So that leaves the Regime Model. Can you expand on that? This sounds particularly interesting.
KS: I agree. In business school, it is common for finance professors to review the Fama French model in which the expected “total” return of a stock is driven by the exposure to the market, size, and value. The market “relative” return of a stock is thus driven by a stock’s exposure to size and value. Finance professors tend to then typically review a lot of data and conclude that over the long run, if one buys small cap value stocks, they may potentially outperform the market. While this is conceptually correct, the long run for an academic might be ten years.
After surveying numerous allocators, I found that historically the most popular time-period that they use to evaluate performance is the most recent three years, followed by the most recent five years.
In the late 1990s, Growth stocks outperformed Value stocks. The internet Bubble finally blew up from 2000 to 2002, during which period Value stocks outperformed Growth stocks. This was followed by a significant “Junk Rally” in the second and third quarter of 2003, when low-priced, low-quality stocks performed well.
At a high level, there was a shift from Risk On in the late 1990s, to Risk Off from 2000 to 2002, to an extreme level of Risk On in primarily two quarters in 2003. Put another way, first Growth stocks outperformed, then Value stocks outperformed, then Growth stocks outperformed again.
In my experience, many Growth and Value managers tend to be very passionate about their investing styles. Growth managers look for the latest new technology. Lately this has often had to do with AI. Growth managers also likely then pay a high multiple of future earnings or cashflow to buy these stocks. Value managers historically admit that they seek to provide a steady allocation in a broader portfolio, likely not investing in companies that may cure cancer or reinvent the internet. They continue to state that they invest in “boring” companies, but these companies have had real earnings, and today, they buy these companies at attractive valuations. They often point out that Value strategies have the potential to hold up in times of market turmoil.
A Regime approach to investing historically does not categorically embrace Growth or Value as an inherently better method of investing. Instead, it relies on a model that indicates one of these styles is likely to outperform over the medium term. In our case we use a combination of Macro data and Relative Valuation to determine which of these styles is likely to outperform.
Very few managers take a Regime approach to investing. Based on manager databases and conversations with sellside strategists that publish on Regime models, we believe there might be about 20 managers in the industry that have a formal Regime approach to investing.
Uncorrelated: This does indeed seem like a very differentiated feature. Can you discuss why a Regime approach to investing may be particularly important at this point in time?
KS: It is the very same reason why I believe your Uncorrelated Conference is timely. I have brought with me a chart showing the relative valuation of the U.S. equity market for the last 130 years. Initially the valuation represented the PE ratio developed by Robert Shiller, known as the Cyclically Adjusted Price to Earnings Ratio, or CAPE. Over time, as additional information became available, other valuation metrics were included. These individual valuation metrics were combined on an equal-weighted basis to establish a composite valuation metric for the U.S. equity market.
The y-axis is on a scale from 0% to 100%. This represents the percentile ranking since inception of the chart for the composite valuation metric up until that point in time. When the line reaches 100%, this indicates that the U.S. equity market has never been as expensive as it had been, up until that point in time.
The U.S. equity market peaked in 1929, as referenced in the first red circle in the chart, just before the market crashed leading to the Depression in the 1930s. The U.S. equity market finally recovered 25 years later in 1954.
The U.S. equity market then continued to rise until 1968. At that point, as referenced in the second red circle in the chart, the U.S. equity market reached a valuation similar to the level in 1929. The U.S. equity market endured multiple bear market declines during the 1970s, before finally recovering 14 years later in 1982.
The U.S. equity market, once again, then continued to rise until 2000. Just before the peak of the market, as referenced in the third red circle in the chart, the U.S. equity market, once again, reached a valuation similar to the level in 1929. The U.S. equity market, once again, endured two bear market declines consisting of the bursting of the Dot-com Bubble and the Global Financial Crisis, before finally recovering 13 years later in 2013.
Today, the U.S. equity market is, again, at a valuation similar to the level in 1929. When the multiple of the U.S. equity market expands, this corresponds with multi-year periods during which the U.S. equity market generates above-average returns. When the multiple of the U.S. equity market contracts, this corresponds with multi-year periods during which the U.S. equity market generates 0% annualized returns.
I believe the U.S. equity market is due for a multi-year period during which the multiple of the U.S. equity market contracts, and the U.S. equity market generates 0% annualized returns.
Many products that are marketed as solutions to diversify a Long portfolio have correlations with the S&P 500 Index of approximately .85 to .90, and, in my experience, are unlikely to deliver returns that keep up with inflation during a multi-year period when the S&P 500 Index may generate 0% annualized returns. Some Long Short equity strategies have much lower correlations with the S&P 500 Index, and may be better positioned for such a time period. In our case, this is due to the Regime Model. While the S&P 500 Index generated 0% annualized returns from 2000 to 2013, there were several year time periods when Growth stocks outperformed, then Value stocks outperformed, etc. Having the ability to shift between tilting to Growth stocks and Value stocks has the potential ability to generate absolute returns during such a time period.

Uncorrelated: I understand you have partnered with Harbor Capital, in the launch of an ETF version of your strategy. Can you tell us more about this?
KS: We are very excited about this partnership. Harbor Capital has $58.79 billion in assets under management as of March 31, 2025. In the last few years, the mutual fund industry has shown signs of maturing while the ETF industry has expanded dramatically. As of December 2024, and according to available information on the ETF market, in 2023, the overall ETF market grew 15%, while the Active ETF market grew approximately 46%. The figures for 2024 are ahead of the 2023 pace. The overall ETF market now exceeds $10 trillion in assets. In the last three years, Harbor Capital has focused on bringing compelling ETF products to the marketplace. They now offer about 20 ETF products across a variety of asset classes. They also have a salesforce with coverage throughout the country.
The Disciplined Alpha Onshore Fund LP, which launched almost ten years ago, was reorganized into the Harbor Long-Short Equity ETF in December 2023. We agreed and after a lot of work by both parties, this was one of the first hedge fund to ETF conversions in the industry.
Uncorrelated: Sounds like an exciting partnership. Thank you for your time.
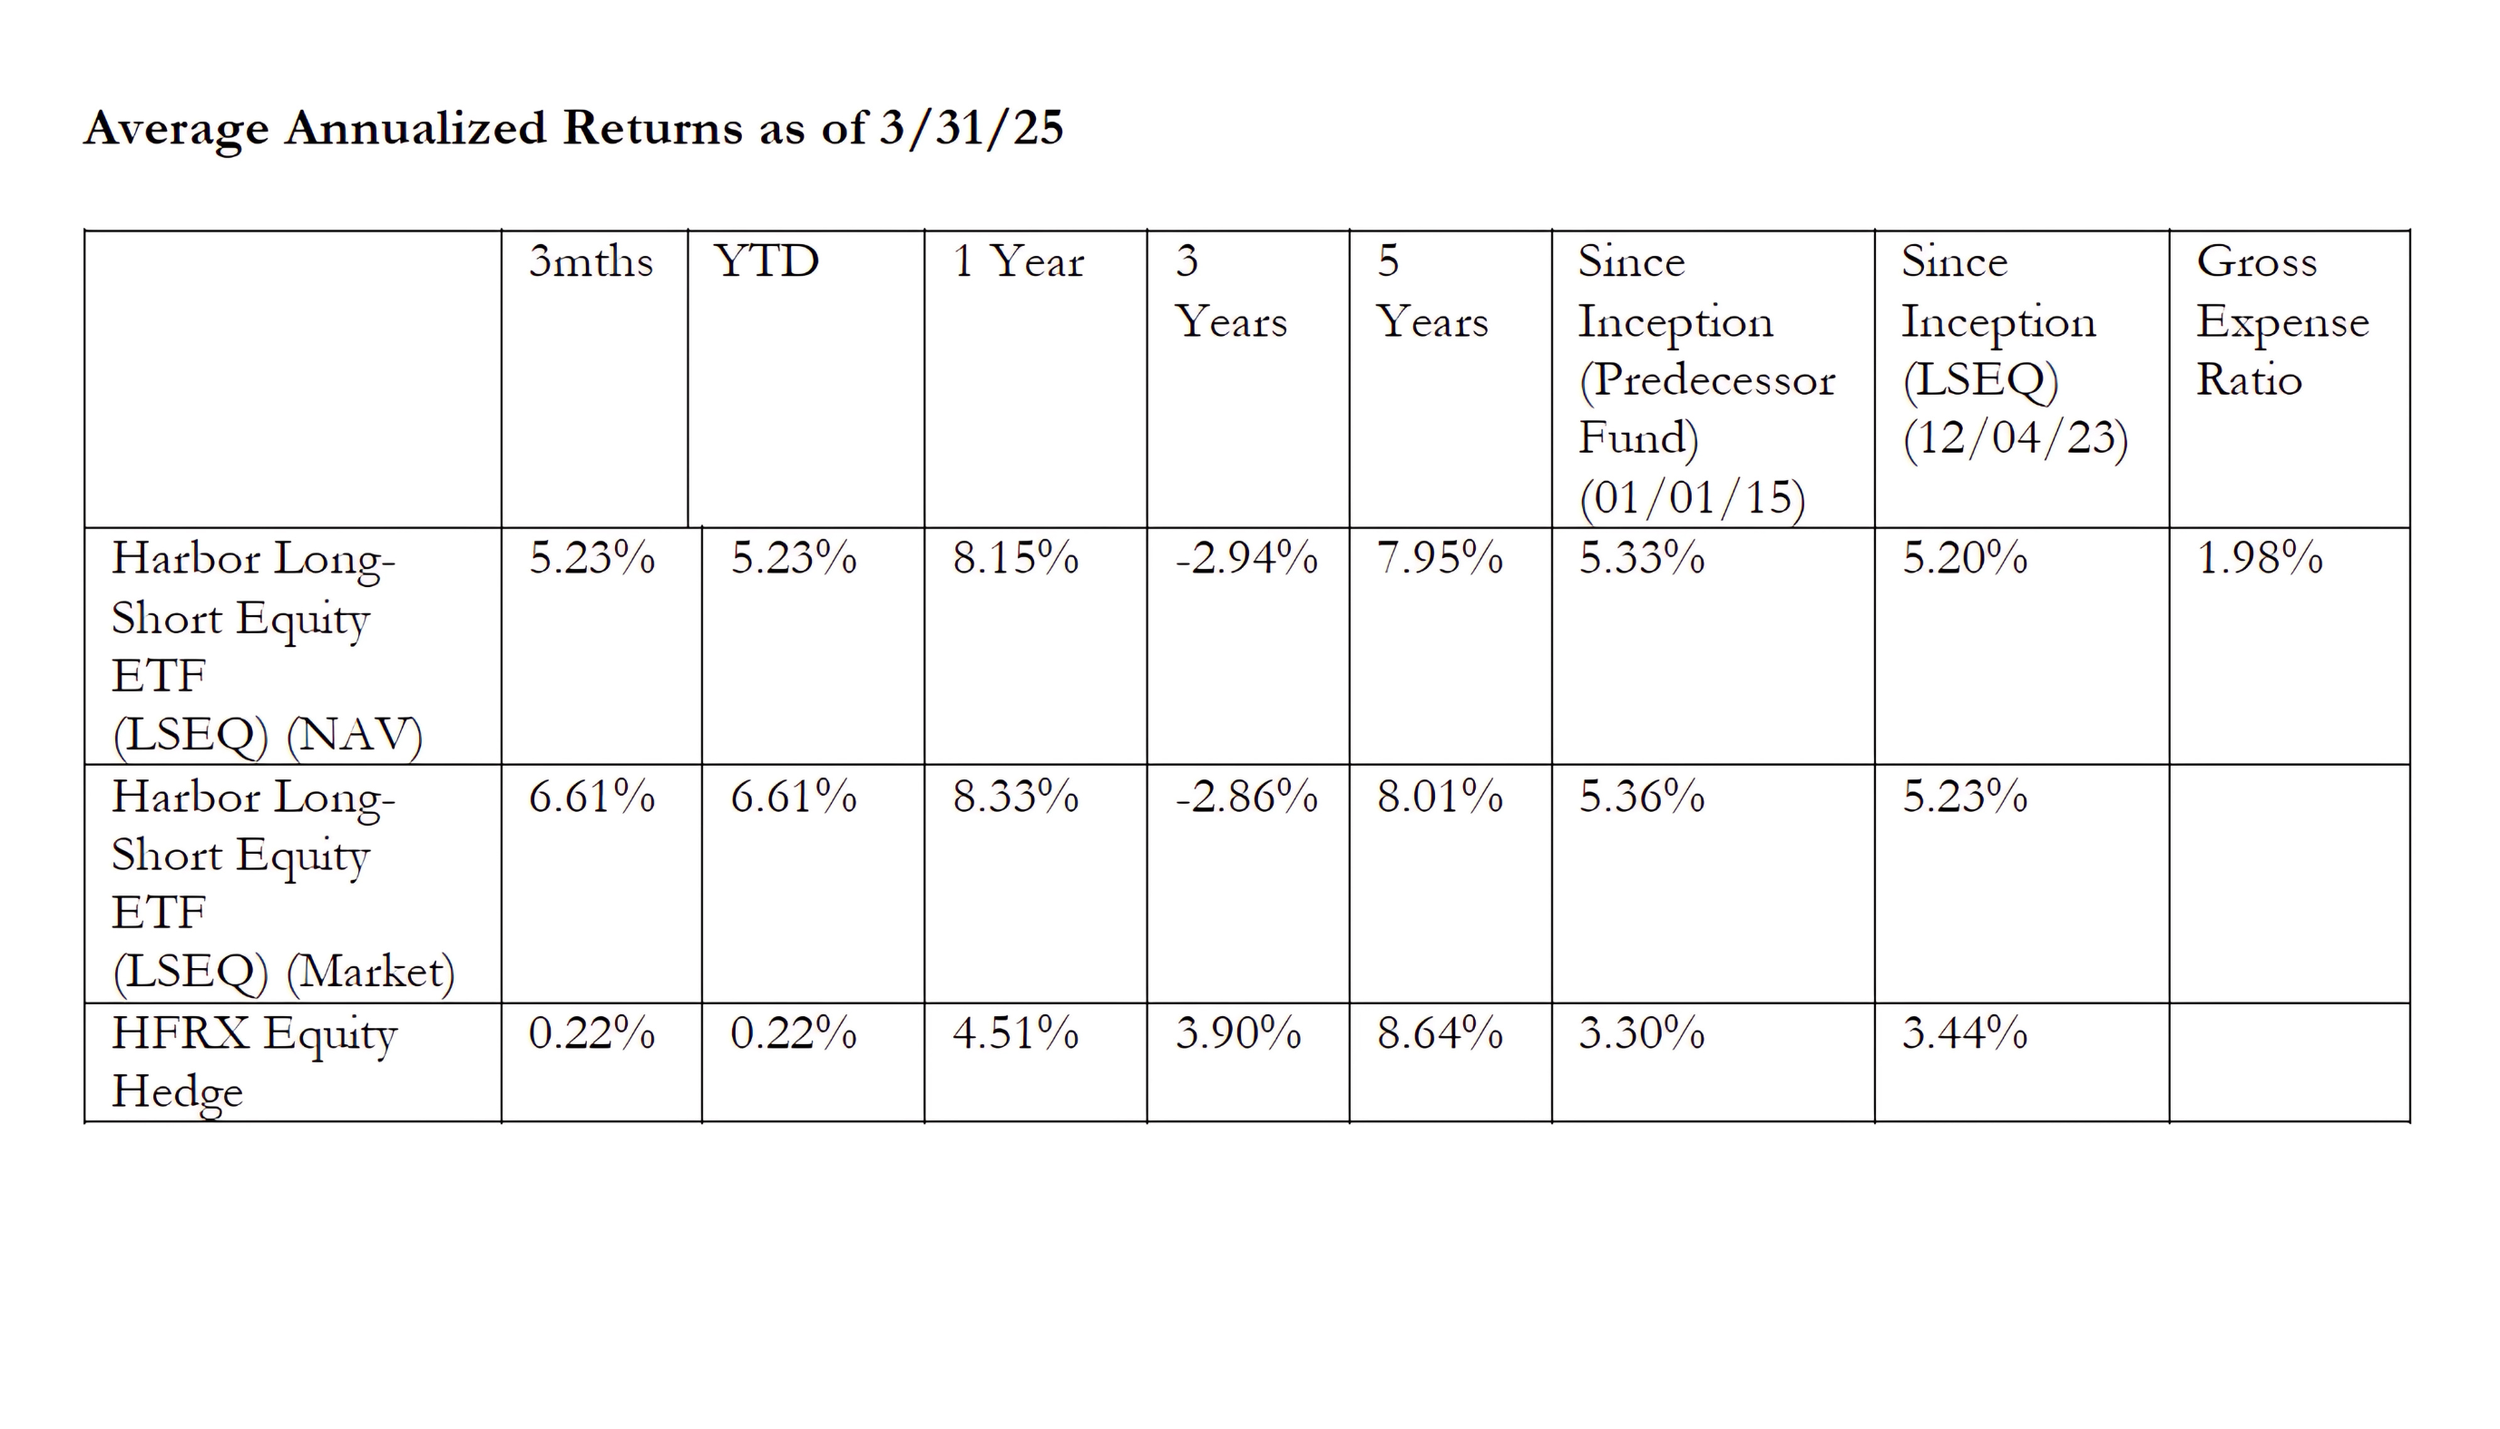
Performance data shown represents past performance and is no guarantee of future results. Past performance is net of management fees and expenses and reflects reinvested dividends and distributions. Past performance reflects the beneficial effect of any expense waivers or reimbursements, without which returns would have been lower. Investment returns and principal value will fluctuate and when redeemed may be worth more or less than their original cost. Returns for periods less than one year are not annualized. Current performance may be higher or lower and is available through the most recent month end at harborcapital.com or by calling 800-422-1050.
ETF performance prior to 12/4/23 is attributable Disciplined Alpha Onshore Fund LP (the “Predecessor Fund”). The historical NAV of the predecessor are used for both NAV and Market Offer Price performance from inception to ETF listing date. Performance periods since LSEQ listing date may contain NAV and
MOP data of both the newly formed ETF and the predecessor fund performance. Please refer to the Fund prospectus for further details.
Shares are bought and sold at market price not net asset value (NAV). Market price returns are based upon the closing composite market price and do not represent the returns you would receive if you traded shares at other times.
Important Information
For Institutional Use Only. Not for Distribution to the Public.
The HFRX Equity Hedge Index measures the performance of the hedge fund market. Equity hedge strategies maintain positions both long and short in primarily equity and equity derivative securities. A wide variety of investment processes can be employed to arrive at an investment decision, including both quantitative and fundamental techniques; strategies can be broadly diversified or narrowly focused on specific sectors and can range broadly in terms of levels of net exposure, leverage employed, holding period, concentrations of market capitalizations and valuation ranges of typical portfolios.
All investments involve risk including the possible loss of principal.
Unlike mutual funds, ETFs may trade at a premium or discount to their net asset value. The ETF is new and has limited operating history to judge.
The views expressed herein are those of Kevin Shea, Disciplined Alpha at the time the comments were made. These views are subject to change at any time based upon market or other conditions, and the author/s disclaims any responsibility to update such views. These views may not be relied upon as investment advice and, because investment decisions are based on many factors, may not be relied upon as an indication of trading intent. The discussion herein is general in nature and is provided for informational purposes only.
There is no guarantee as to its accuracy or completeness. Past performance is no guarantee of future results.
There is no guarantee that the investment objective of the Fund will be achieved. Stock markets are volatile and equity values can decline significantly in response to adverse issuer, political, regulatory, market and economic conditions. Short selling securities could potentially have unlimited loss due to the price of securities sold short increasing beyond the cost of replacement and the limitless increase on the value of a security. The Fund utilizes a quantitative model and there are limitations in every quantitative model. There can be no assurances that the strategies pursued or the techniques implemented in the quantitative model will be profitable, and various market conditions may be materially less favorable to certain strategies than others. The Harbor Long-Short Equity ETF (the "Fund") acquired the assets and assumed the then existing known liabilities of the Disciplined Alpha Onshore Fund LP (the "Predecessor Fund"), a Delaware limited partnership, on 12/4/23, and the Fund is the performance successor of the reorganization. This means that the Predecessor Fund's performance and financial history will be used by the Fund going forward from the date of reorganization. Performance information prior to 12/4/23 reflects all fees and expenses, including a performance fee, incurred by the Predecessor Fund. Disciplined Alpha LLC ("Disciplined Alpha") served as the general partner and investment manager to the Predecessor Fund, which commenced operations on 1/1/15 and, since that time, implemented its investment strategy indirectly through its investment in a master fund, which had the same general partner, investment manager, investment policies, objectives, guidelines and restrictions as the Predecessor Fund. Regardless of whether the predecessor fund operate as a stand-alone fund or invested indirectly through a master fund, Disciplined Alpha managed the Predecessor Fund assets using investment policies, objectives, guidelines and restrictions that were in all material respects equivalent to those of the Fund. However, the Predecessor Fund was not a registered fund and so it was not subject to the same investment and tax restrictions as the Fund. If it had been, the Predecessor Fund's performance may have been lower.
Diversification does not assure a profit or protect against loss in a declining market.
ETFs are subject to capital gains tax and taxation of dividend income. However, ETFs are structured in such a manner that taxes are generally minimized for the holder of the ETF. An ETF manager accommodates investment inflows and outflows by creating or redeeming “creation units,” which are baskets of assets. As a result, the investor usually is not exposed to capital gains on any individual security in the underlying portfolio. However, capital gains tax may be incurred by the investor after the ETF is sold.
Indices listed are unmanaged and do not reflect fees and expenses and are not available for direct investment.
The Standard & Poor’s 500 Index is an unmanaged index generally representative of the U.S stock market.
The Russell 1000 Growth Index is an unmanaged index generally representative of the U.S. market for larger capitalization growth stocks.
The Russell 1000 Value Index is an unmanaged index generally representative of the U.S. market for larger capitalization value stocks.
Investors should carefully consider the investment objectives, risks, charges and expenses of a Harbor fund before investing. To obtain a summary prospectus or prospectus for this and other information, visit harborcapital.com or call 800-422-1050. Read it carefully before investing.
Foreside Fund Services, LLC is the Distributor of the Harbor Long-Short Equity ETF.

Kevin W. Shea, CFA
Chief Executive Officer
Portfolio Manager
Disciplined Alpha LLC
Mr. Shea is CEO of Disciplined Alpha LLC. and has 25 years of investment experience. Previously he was the Director of Quantitative Research at Cadence Capital, responsible for implementing a regime-based approach across multiple products representing $5 bb. Mr. Shea has also held the positions of Portfolio Manager at Batterymarch where he managed $600 mm, and CIO and Founder of DA Capital where he grew the firm from $10 mm to $450 mm over four years. He has also been a Portfolio Manager at Invesco, responsible for $100 mm, and a Quantitative Analyst at John Hancock Funds. Mr. Shea holds a B.A. in Liberal Studies from the University of Notre Dame, an A.L.M. in Biology from Harvard University, and an M.B.A. in Finance and International Studies from Boston College. Mr. Shea co-teaches a Proseminar in Finance at MIT's Sloan School of Management. He is a member of the CFA Institute, and the Institute for Quantitative Finance, also known as the Q Group. He is also a member of the Financial Accounting Standard Board’s (FASB’s) Investor Advisor Committee (IAC). Mr. Shea has been quoted in numerous publications including aiCIO, Emerging Manager Monthly, Hedge Fund Alert, HFM Week, Institutional Investor, and WatersTechnology. He has spoken at numerous conferences in the U.S. and internationally sponsored by Allianz, Argyle Executive Forum, Battle of the Quants, Capital IQ, FactSet, HFM Week, International Quality & Productivity Center, Northfield and Sentiment Analysis Symposium.