Dual Momentum Allocation Between Physical Gold and Bitcoin (Digital Gold)

By Radovan Vojtko
From the trading desk to the portfolio committee, investors face a familiar question: how should alternative stores of value fit into a diversified portfolio? This research explores that question through a systematic dual-momentum framework comparing Bitcoin and physical gold in a rules-based tactical allocation model. Rather than debating ideology, we focus on practical portfolio construction and risk-adjusted returns. The goal is to examine whether “digital gold” can complement its physical counterpart within a disciplined investment process, and whether the distinct behavior of these assets can be used to build a more effective systematic strategy.
Related Literature
Gold’s millennia-spanning role as a store of value rests on fundamental supply dynamics: annual mining production adds merely 1-2% to existing above-ground stocks, creating a naturally constrained supply schedule that has underpinned its monetary premium across civilizations (Erb & Harvey; 2013, 2016). Bitcoin’s protocol-encoded scarcity mirrors this characteristic, with its halving mechanism ensuring that new issuance similarly represents a diminishing fraction of total supply, leading proponents to christen it “digital gold” (Baur et al.; 2018, 2018). However, empirical evidence complicates this narrative: Bitcoin exhibits a significant correlation with risk assets during periods of stress, undermining its purported role as an uncorrelated store of value (Corbet et al.; 2018, 2018). This tension between theoretical promise and realized behavior motivates our investigation into whether systematic momentum-based allocation can extract the benefits of both assets while mitigating their respective weaknesses.
Data and Methodology
Investment Universe and Data Construction
The analysis employs liquid, exchange-traded vehicles to ensure implementability in live trading environments. For physical gold exposure, we use the SPDR Gold Trust (GLD), the world’s largest physically backed gold ETF with superior liquidity. Bitcoin exposure is lastly captured through the iShares Bitcoin Trust (IBIT), which replaced its previous tracking vehicle, the ProShares Bitcoin Strategy ETF (BITO), after the introduction of a spot Bitcoin ETF, due to IBIT’s robust liquidity profile.
Raw BTC/USD price data originates from the Bitfinex exchange (hourly bars), which we resample into a continuous series aligned with GLD’s data sample start date, December 31, 2018. This data pipeline—Bitfinex hourly → IBIT/BITO proxy → GLD alignment—creates a unified dataset for comparative analysis spanning from December 31, 2018, through April 2026, encompassing multiple complete market cycles, including the COVID-19 crash, the subsequent bull market, and the crypto winter of 2022-2023.
Prior to merging, we screened GLD for valid NYSE trading days to pre-filter, then matched each selected GLD observation to its contemporaneous Bitcoin timestamp. The raw Bitcoin dataset was subsequently filtered strictly for GLD closing times on NYSE exchange —this timestamp serving as the definitive settlement price for Bitcoin and used in confluence with GLD data to ensure session-aligned, point-in-time consistency across the paired time series.
We employ weekly rebalancing at Wednesday’s close—a deliberate choice balancing competing practical concerns. Daily rebalancing incurs prohibitive transaction costs and noise from intraday volatility, while monthly frequencies prove too sluggish to capture momentum signals effectively in fast-moving cryptocurrency markets. Wednesday minimizes holiday-related market closure artifacts, as mid-week holidays are statistically less frequent than Monday or Friday observances, ensuring consistent execution across the backtest period. This weekly frequency represents the sweet spot between signal responsiveness and implementation feasibility.
Benchmark Portfolios
We establish three passive benchmarks for performance attribution and context:
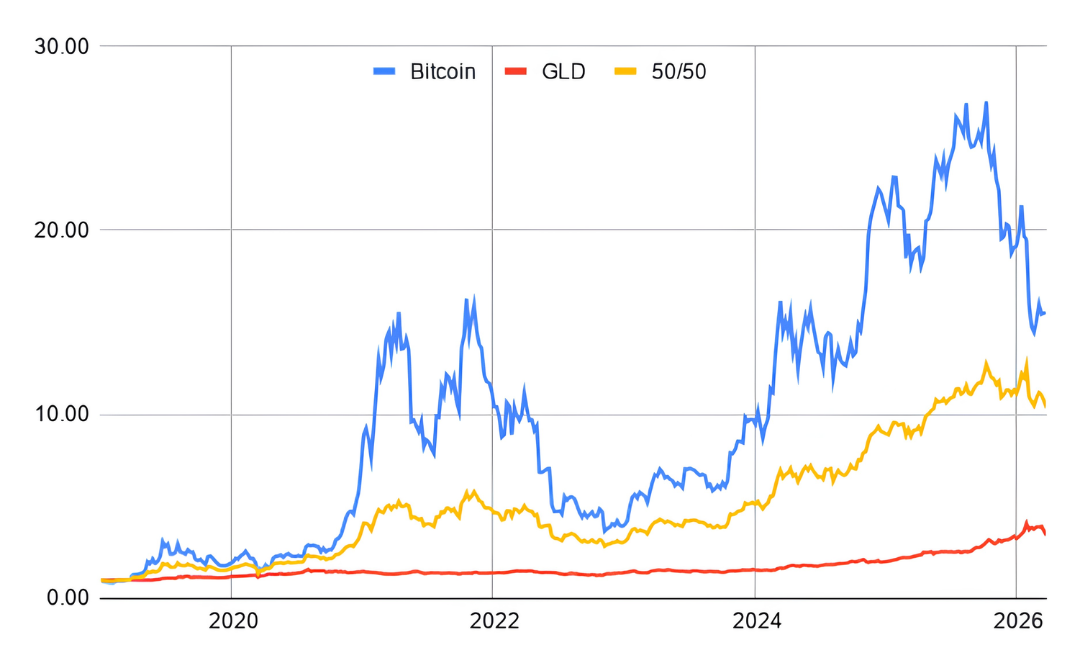
Figure 1. Buy-and-Hold Benchmark Performance Comparison
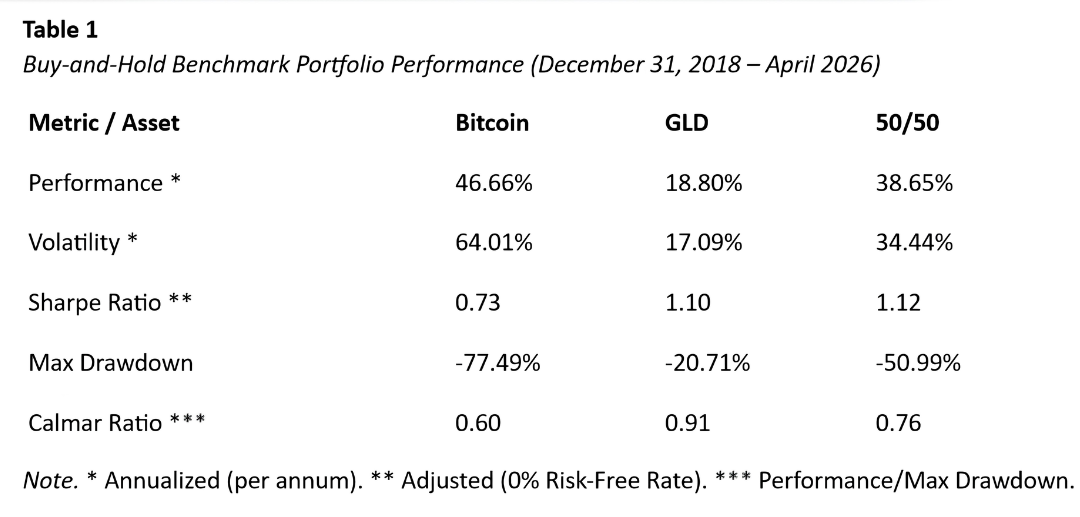
The benchmarks reveal the classic risk-return dichotomy with stark clarity: Bitcoin delivers superior absolute returns (46.66% p.a.) but at the cost of extreme volatility (64.01%) and catastrophic drawdowns (-77.49%), while gold provides stability (17.09% volatility, -20.71% drawdown) at the expense of return potential (18.80% p.a.).
The 50/50 blend offers intermediate characteristics but fails to resolve the fundamental tension between the two assets—it captures only 38.65% returns while still suffering a -50.99% drawdown, demonstrating that naive diversification cannot solve the Bitcoin-gold allocation challenge.
Methodological Framework: Dual Momentum
Our systematic model draws inspiration from Antonacci’s (2014, 2016) dual-momentum framework and the paired-switching methodology documented in the quantitative finance literature. The strategy employs a single tunable parameter: the lookback period X (measured in weeks) for momentum calculation, tested at 1, 2, 3, 4, 6, 8, 12, 20, 24, and 28 weeks.
The allocation rule operates as follows at each Wednesday rebalancing:
Long IBIT if: (IBIT return over X weeks > GLD return over X weeks) AND (IBIT return over X weeks > 0%)
Long GLD if: (GLD return over X weeks > IBIT return over X weeks) AND (GLD return over X weeks > 0%)
Flat (cash at 0%) otherwise
This structure embeds both relative momentum (choosing the stronger performer between the two assets) and absolute momentum (requiring positive returns as a threshold), with the flat position providing implicit downside protection when neither asset exhibits positive momentum. The strategy can thus switch among Bitcoin, gold, and cash, but never hold both assets simultaneously—this is a tactical, not strategic, allocation framework.
Volatility Targeting Mechanism
Recognizing Bitcoin’s extreme volatility relative to gold, we further implement a volatility cap to constrain portfolio risk to a maximum of 20% annualized volatility. This is not a target to be achieved, but rather a hard upper bound that cannot be exceeded.
At each Wednesday rebalancing, after the dual momentum signal selects an asset (IBIT or GLD), we calculate its 12-week rolling standard deviation and annualize it by multiplying by √52 (the square root of the number of weeks per year, approximately 7.21).
The position sizing formula is: Position Weight = min(20% ∨ Annualized Volatility)
This ensures the portfolio volatility never exceeds 20%. For example:
If the selected asset exhibits 23% annualized volatility, we allocate 87% (20%/23%) of portfolio capital to that asset, with the remaining 13% held in cash.
If the selected asset exhibits 15% annualized volatility, we allocate 100% of portfolio capital (capped as the full investment).
If the selected asset exhibits 40% annualized volatility, we allocate only 50% (20%/40%) to that asset.
This mechanism provides systematic, rules-based risk control that automatically reduces exposure during high-volatility regimes—precisely when drawdown risk is elevated. The 20% volatility cap is chosen to approximate the risk profile of a traditional equity-like portfolio, making it familiar to institutional investors while still allowing meaningful participation in the underlying assets’ returns.
Results
Pure Dual Momentum Strategy
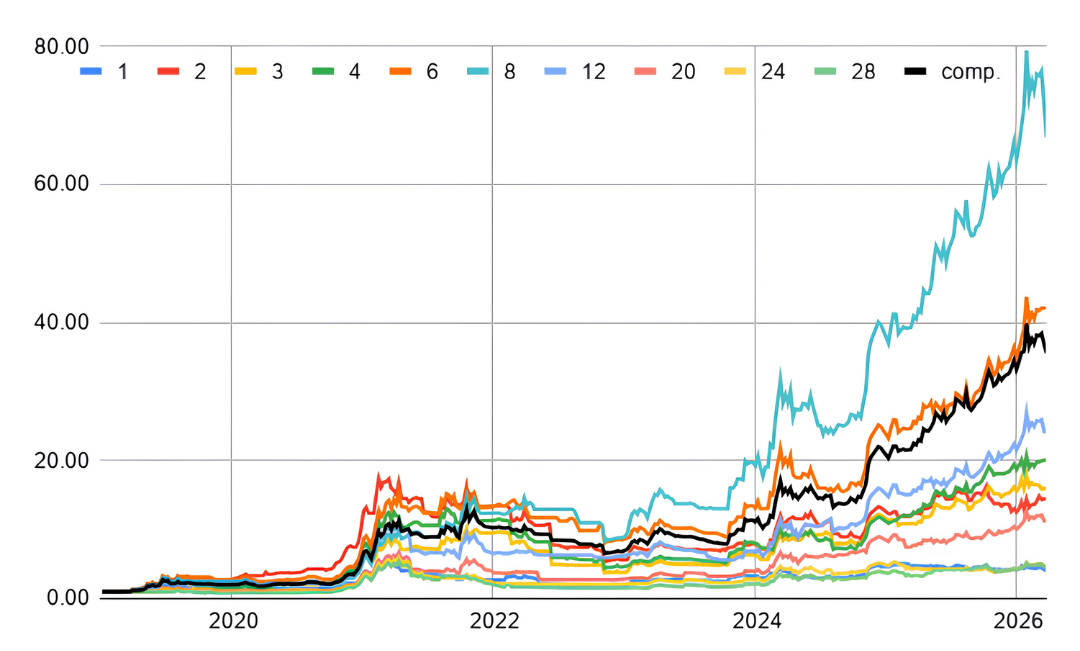
Figure 2. Pure Dual Momentum Strategy Performance Across Lookback Periods
Table 2
Pure Dual Momentum Strategy Performance Across Momentum Lookback Periods (December 31, 2018 – April 2026)
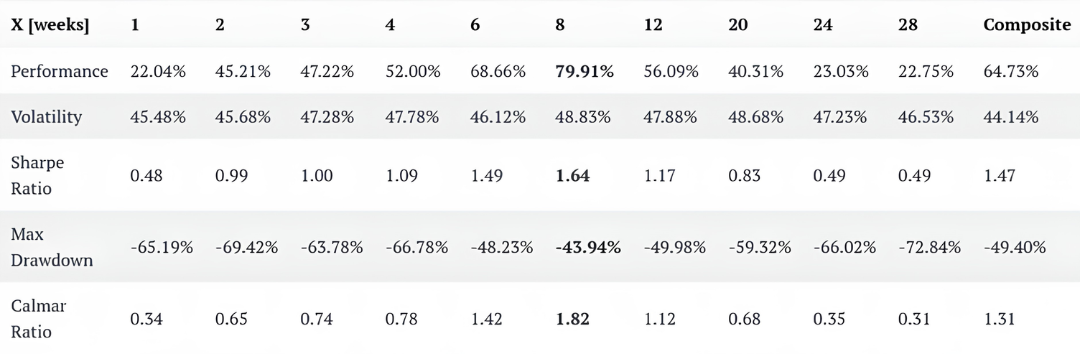
Note. Bold indicates the optimal single parameter; Composite represents the equal-weighted average of the 4-, 8-, and 12-week strategies.
The pure dual momentum strategy exhibits a pronounced performance “sweet spot” between 4 and 12-week lookback periods, with the 8-week variant delivering exceptional 79.91% annualized returns and a Sharpe ratio of 1.64—substantially outperforming both the 50/50 benchmark (38.65% returns, 1.12 Sharpe) and pure Bitcoin buy-and-hold (46.66% returns, 0.73 Sharpe).
To mitigate this parameter sensitivity risk, we construct a composite strategy averaging the 4-, 8-, and 12-week variants, which delivers robust 64.73% annualized returns with a Sharpe ratio of 1.47 and a maximum drawdown of -49.40%—still quite risky, but capturing substantial upside participation if we compare this with benchmark performance. The strategy’s inability to prevent drawdowns approaching 50% underscores a critical limitation: while dual momentum successfully navigates between assets based on relative and absolute strength, it cannot escape systemic risk when both Bitcoin and gold decline simultaneously, as occurred during the 2022 risk-off environment.
Volatility-Capped Dual Momentum Strategy
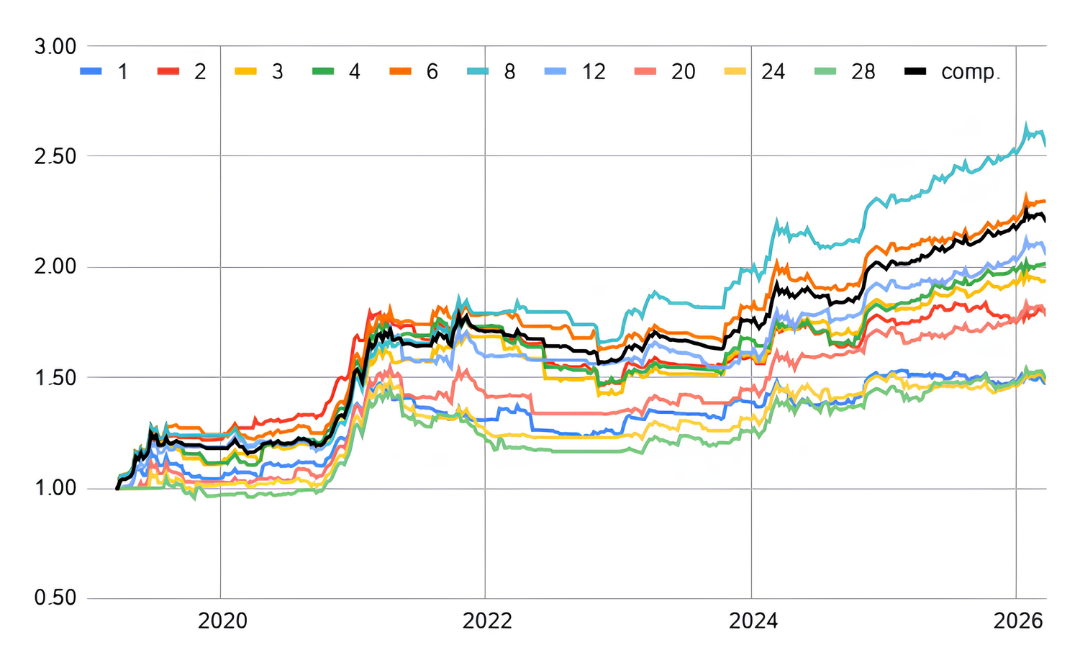
Figure 3. Volatility-Capped Dual Momentum Strategy Performance Across Lookback Periods
Table 3
Volatility-Capped Dual Momentum Strategy Performance Across Momentum Lookback Periods With 20% Maximum Annualized Volatility Constraint (December 31, 2018 – April 2026)
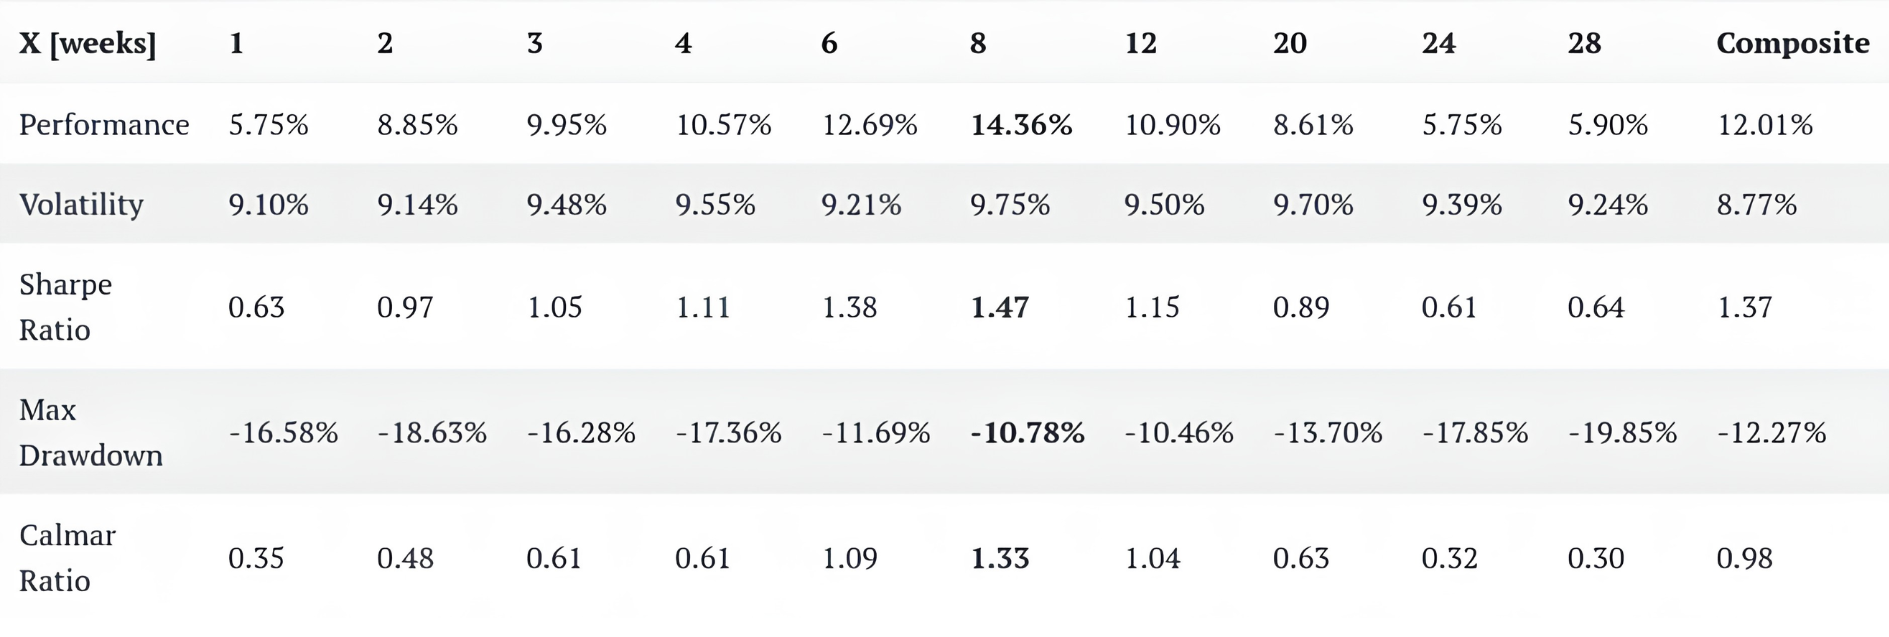
Note. Bold indicates the optimal single parameter; Composite represents the equal-weighted average of the 4-, 8-, and 12-week strategies. Portfolio volatility is capped at 20% annualized.
The introduction of the 20% volatility cap fundamentally transforms the strategy’s character, reducing the composite version’s annualized volatility from 44.14% to just 8.77%—remarkably lower even than gold’s standalone 17.09% volatility—while constraining maximum drawdown to a tolerable -12.27%, a dramatic improvement over the pure strategy’s -49.40% drawdown. This dramatic risk reduction comes at the predictable cost of absolute return, with the composite strategy delivering 12.01% annualized performance versus the pure strategy’s 64.73%. Critically, however, the risk-adjusted metrics remain attractive: the volatility-capped composite achieves a Sharpe ratio of 1.37 and a Calmar ratio of 0.98, demonstrating that systematic volatility control can extract meaningful alpha while maintaining risk parameters suitable even for more conservative mandates.
Conclusions
The empirical evidence reveals a fundamental truth that every practitioner must confront: there is no free lunch in quantitative finance, only explicit trade-offs between return, risk, and implementability. The pure dual momentum strategy’s spectacular 79.91% annualized return (8-week lookback) tempts the greedy, but its -43.94% maximum drawdown terrifies the prudent. The volatility-capped variant’s modest 14.36% return may disappoint return-hungry investors, but its -10.78% drawdown comforts risk-averse investors. Which is “better”? The question itself betrays a misunderstanding—the answer depends entirely on the specific mandate, constraints, and portfolio context in which the strategy operates. Each variant, implemented with rigor, appropriate expectations, and honest acknowledgment of limitations, can add value to the sophisticated practitioner’s toolkit as we navigate the uncertain frontier where digital assets meet traditional portfolio construction. The data speaks clearly: systematic rules beat discretionary intuition, risk control enables survival, and there are no shortcuts to disciplined investing.

Radovan Vojtko
Head of Research
Quantpedia
Radovan Vojtko is a former Systematic Portfolio Manager, in the past, he worked for the Tatra Asset Management company (which is the biggest asset management company in the Slovak Republic and it has over 2.5 billion EURs of assets under management). He personally managed over 300+ million EUR in several quantitative funds. These funds were focused on multi-asset managed futures and trend-following strategies, global tactical asset allocation, market timing, and volatility trading. He made his next big step in 2015 and became CEO of Quantpedia.com - The Encyclopedia of Quantitative Trading Strategies, a quant research company with a mission “to turn financial academic research into a more user-friendly form to help anyone interested in algo/quant trading and systematic investing”.